Huntington's disease

Huntington's disease

IBC-Ab002

Huntington's disease

DiscoveryPreclinicalPhase 1Phase 2Phase 3

Huntington's disease (HD) is an inherited neurodegenerative disorder caused by a CAG repeat expansion in the huntingtin (HTT) gene. CAG refers to a sequence of three DNA building blocks - cytosine, adenine and guanine - repeated consecutively within the gene. An expansion means there are too many copies of this sequence, resulting in an abnormally long stretch of the amino acid glutamine in the huntingtin protein. The mutant protein can misfold and accumulate in neurons, contributing to cellular dysfunction and inflammation.

The progressive degeneration of striatal neurons underlies the loss of motor control, cognition and emotional stability that characterize the disease: involuntary movements, worsening gait and coordination, cognitive decline, and psychiatric symptoms such as depression, irritability and apathy. Symptoms typically appear in mid-adulthood and worsen steadily over the years.

Preclinical studies

Although pathological huntingtin is not the direct target of the treatment, a single dose of anti-PD-L1 led to reduction in HTT aggregates formation by 20%, and delayed the progression of motor deficits in the R6/2 Huntington mouse model. Clinical studies in Huntington's disease will be started upon readout of the ongoing study in 50 patients with Alzheimer's disease.

Soluble HTT

HTT means huntingtin protein. Soluble HTT is the form that remains dispersed rather than forming aggregates.

Source-traced results from the R6/2 Huntington mouse model. Data points, error bars, significance brackets and group labels retain their original plotted positions. Dots and bars rise from the plot baseline on scroll.40003000200010000Soluble mutant HTT(fmol/mg tissue)WTIsotype control d7anti-PD-L1 d7Isotype control d28anti-PD-L1 d28*******p=0.05

Aggregated HTT

Aggregated HTT is huntingtin protein that has accumulated into clumps. These graphs measure mutant HTT in mouse tissue.
Source-traced results from the R6/2 Huntington mouse model. Data points, error bars, significance brackets and group labels retain their original plotted positions. Dots and bars rise from the plot baseline on scroll.150001000050000Aggregated mutant HTT(fmol/mg tissue)WTIsotype control d7anti-PD-L1 d7Isotype control d28anti-PD-L1 d28*********

Neuronal loss

Source-traced results from the R6/2 Huntington mouse model. Data points, error bars, significance brackets and group labels retain their original plotted positions. Dots and bars rise from the plot baseline on scroll.6050403020CA3 neurons total width (µm)WTIsotypecontrolAnti-PD-L1*

Motor function -beam walk

Source-traced results from the R6/2 Huntington mouse model. Data points, error bars, significance brackets and group labels retain their original plotted positions. Dots and bars rise from the plot baseline on scroll.100806040200Fall ratio(slips/steps)WTIsotypecontrolAnti-PD-L1*******

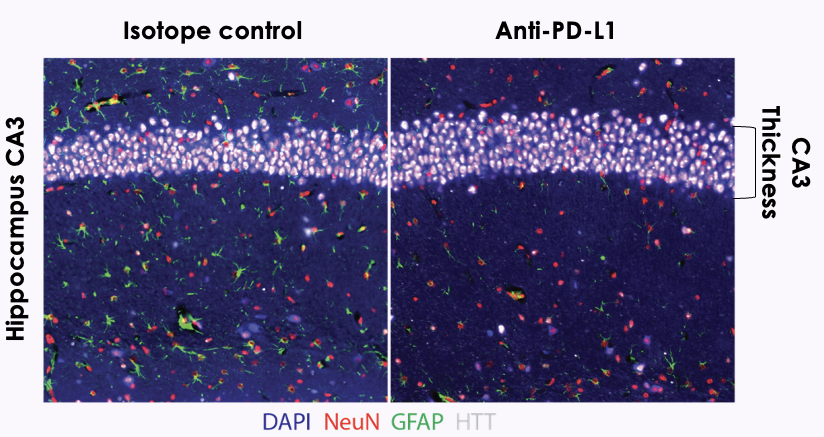
Immunohistochemical analysis of hippocampal brain sections

Immunohistochemical analysis of hippocampal brain sections: CA3 layer thickness in isotype control versus anti-PD-L1 treated R6/2 mice (DAPI, NeuN, GFAP, HTT staining)
CA3 neuronal layer showed lesser thinning following anti-PD-L1 treatment, indicative of an effect on neuronal survival.

Sources

  1. Immune Checkpoint Blockade as a Therapeutic Approach in Huntington's Disease - Society for Neuroscience presentation, listed in the Immunobrain library
All publications